Every river tells a story.
Science on the Fly began in 2019 with a few sites near Telluride, Colorado. Now we have 150 community scientists sampling over 350 sites across the US and internationally.
The interactive maps below show our sampling locations.
We believe our data should be free and open to the public to access. Check out Science on the Fly’s data here.
Please note, it is currently provisional data.
The interactive map below shows average concentrations of Nitrate, Phosphate, and Dissolved Organic Carbon at sites sampled by Science on the Fly. These are critical analyses for determining the health of a river ecosystem.
Nitrate
Nitrate (NO3) is a form of nitrogen, which is essential for all life. Healthy rivers generally have low nitrate concentrations, typically below 250 µg NO3-N per liter, but fertilizer and wastewater often lead to elevated concentrations. When this happens, rivers can suffer through excessive algal growth, which can lead to low oxygen concentrations when the algae decompose. That in turn can kill aquatic organisms, including fish. If nitrate concentrations in a river increase over time, that would be a red-flag indicating the likelihood of increased pollution inputs. Conversely, decreasing nitrate concentrations over time generally indicate improving river health.
Phosphate
Phosphate (PO4) is a form of phosphorus, which like nitrogen is essential for all life. In fact, that is why the two main components of most agricultural fertilizers are nitrogen and phosphorus. As with nitrate, wastewater and fertilizer often add excessive amounts of phosphate to rivers, so tracking phosphate concentrations over time provides clues about a river’s health. Phosphate concentrations are generally much lower than nitrate concentrations, with healthy rivers typically having phosphate concentrations below 25 µg PO4-P per liter.
Dissolved Organic Carbon
Dissolved organic carbon (DOC) occurs naturally in all rivers, where it absorbs UV light and provides energy to the ecosystem. The main source of DOC is decomposing plant and animal material. Wastewater can also contribute DOC to rivers. Climate change can also impact DOC concentrations in rivers. For example, climate driven permafrost thaw in the Arctic can add DOC to rivers. DOC concentrations can also be impacted by forest fire or other changes to a watershed’s vegetation.
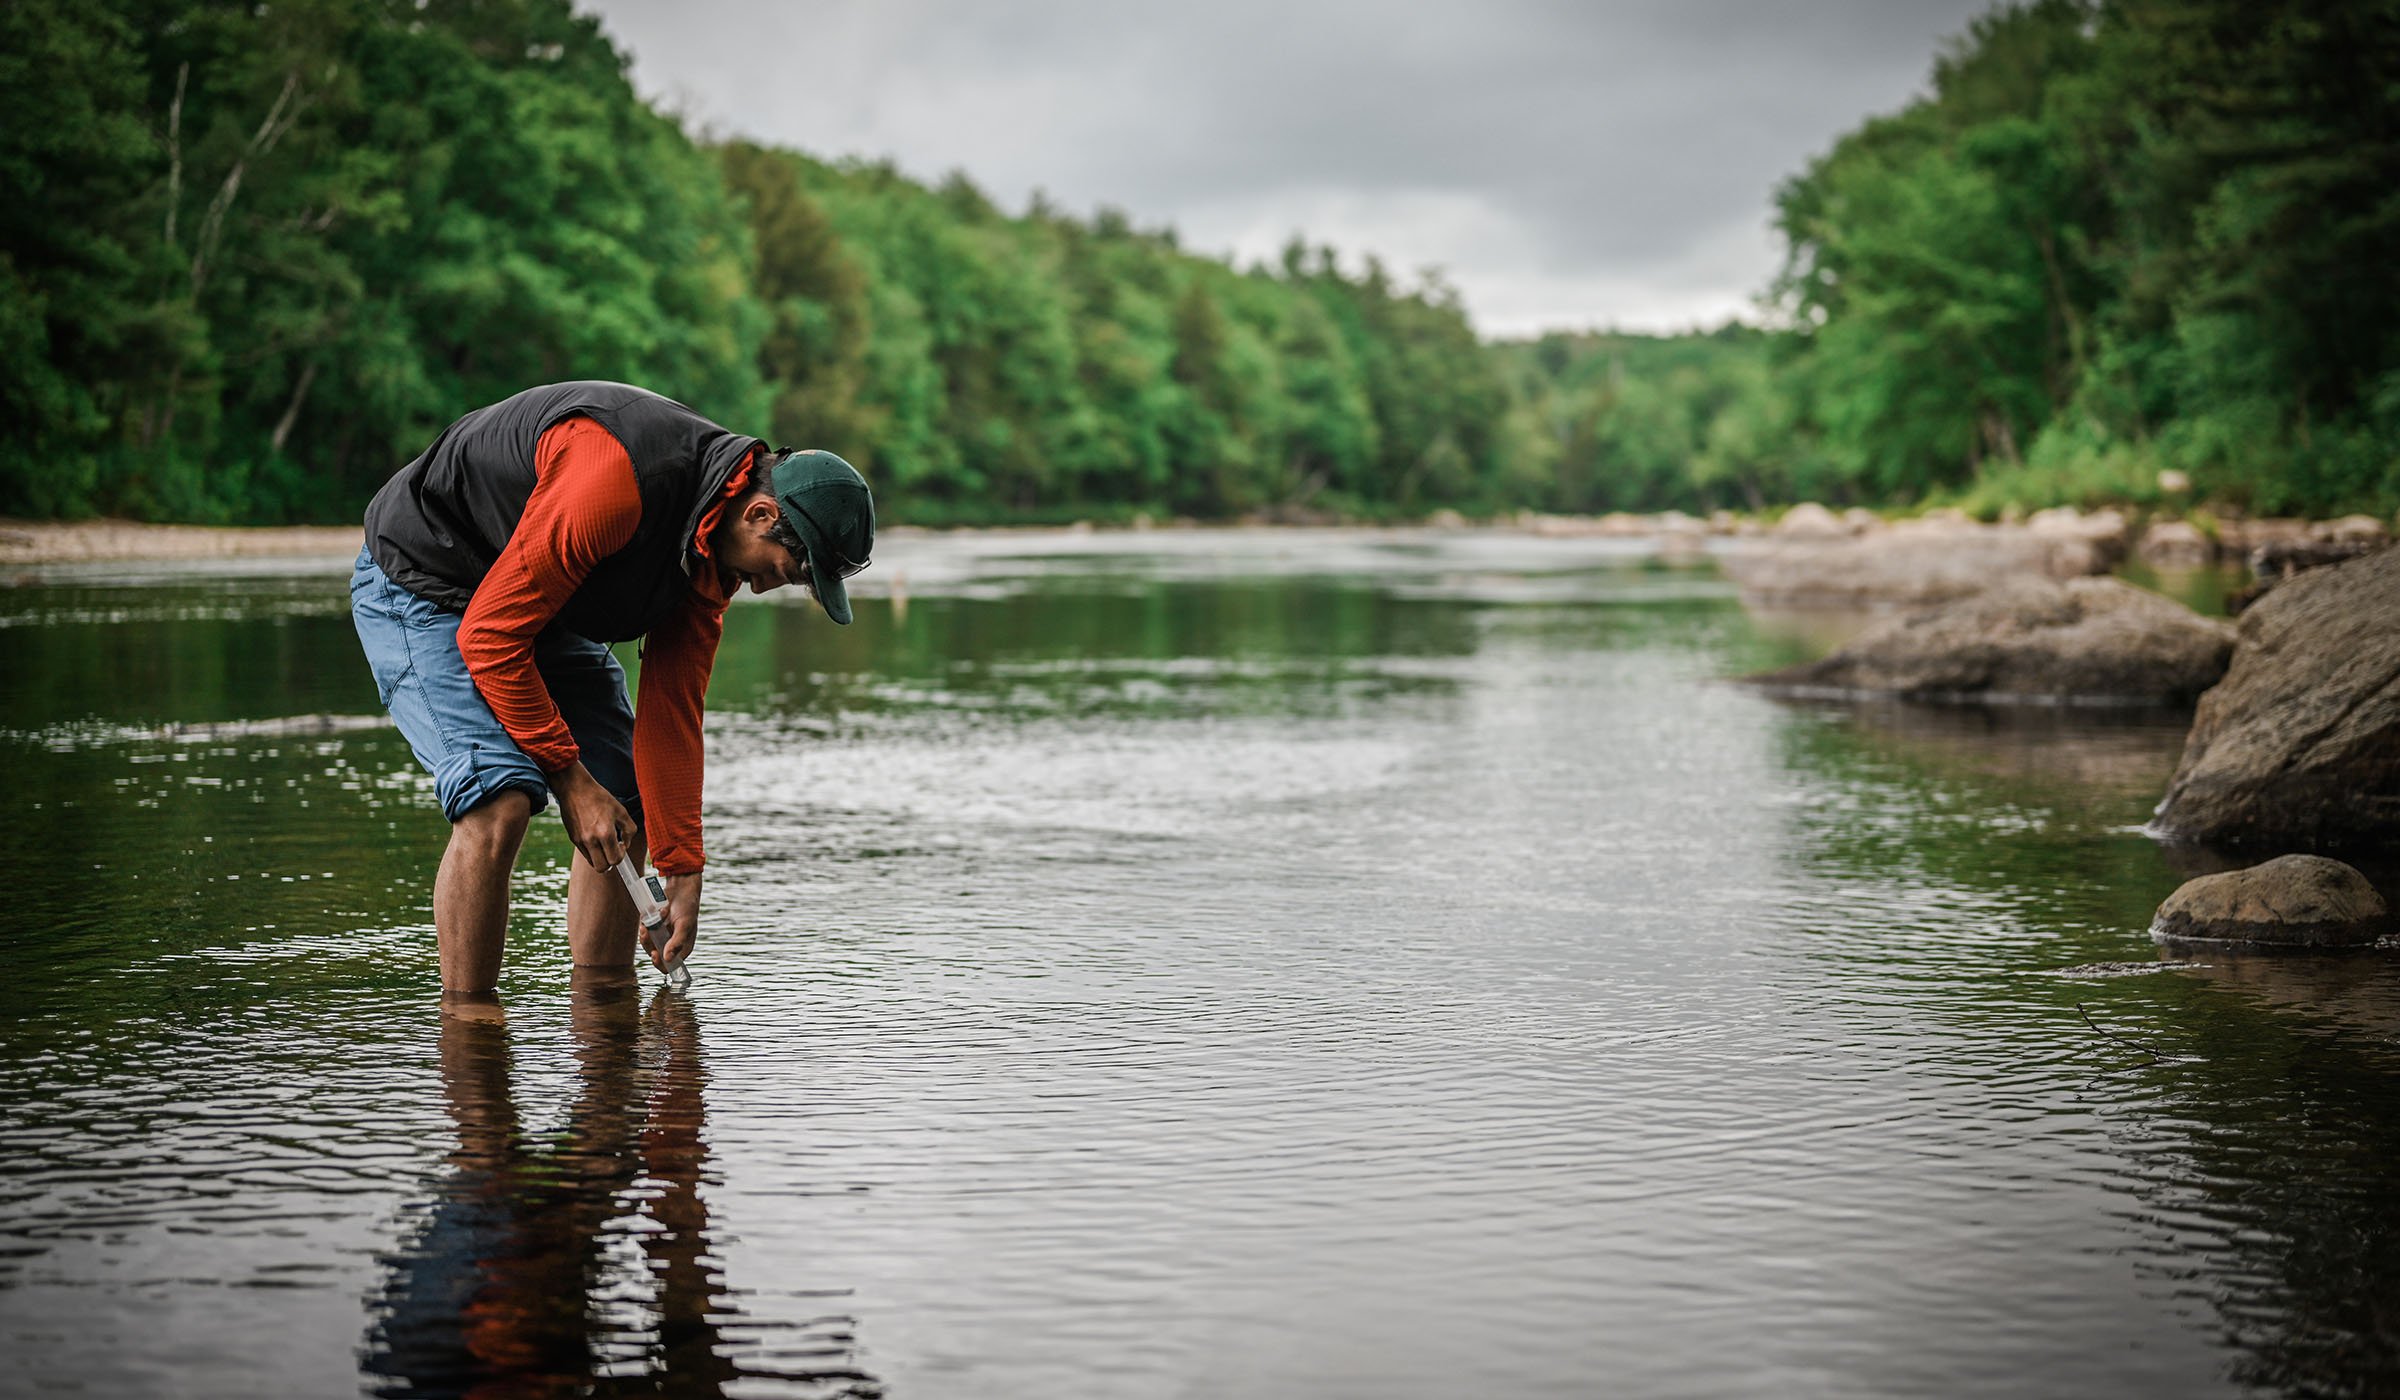
COLLECTING THE SAMPLES
Watch Science on the Fly’s Director Allie Cunningham demonstrate how the sampling process works on the San Miguel River in Telluride, CO.
